Using the understanding gleaned from models and analysis outlined in this post and this notebook, let’s walk through the less technical portion of data science- the subjective art of data-driven decision making.
Product Analytics and Data Science: Setting Key Results
Your company’s product team has the following objective for the quarter:
Improve free trial conversion with the launch of a new product feature
How can we leverage our current models to set appropriate goals for ourselves? After all Analytics Data Science is the art of identifying the levers that control your business and sussing out what happens when you pull them. We need to do four things in order:
Get super pedantic about exactly what we’re measuring- This means making sure everyone is super aligned on exactly what means what. Are conversion rate increases relative or absolute? Do we agree on terminology? Think of this as your key result prenup.
Identify the current baseline conversion rate- another way to think about this is what is our conversion rate ‘naturally’. Economists like to call this ceteris paribus.
Given #1 and #2, build a subjective case for why we think this new product launch will impact conversion to some extent- imagine the last 10 product launches had conversion rate impacts less than 1%. That doesn’t mean a 4% goal is out of the question but it definitely requires a stronger case.
Track progress aggressively after launch- Not just the conversion rate, but also our assumptions and other parts of the product. Are we being successful at the expense of another part of the product? Are we creating unsustainable tech debt?
#1 Getting pedantic about what we’re measuring
In this case we have users (people who use our product in any capacity) who start 14 day free trials on some date. At any point before or after those 14 days they can turn their free trial into a paid subscription. Moreover we know our users are more likely to use desktop computers and those on desktop computers start paid subscriptions at higher rates. Let’s turn all this into some definitions to make things easier to talk about:
Trial: a started free trial that has not converted into a paid subscription. Users who start trials are called trialers. The act of starting a trial can be called trialing
Subscription: a plan that has converted into a paid subscription. Users who start subscriptions are called subscribers (or subs). The act of starting a subscription can be called subscribing or subbing.
Cohort: Free trials that start on the same day. Depending on data this could be a week, a month, a minute etc. Ours happen to be daily cohorts.
Conversion rate: The ratio of subscriptions to trials for a given cohort by a given time. Notice that the word “by” means this measure is cumulative- i.e. if a cohort is 10 days old and so far a total of 200 out of the 1,000 trials in the cohort have subscribed our ‘conversion rate’ is 1:5 or 20%.
Adjusted conversion rate: The conversion rate adjusted for the different rates in which trial started on different devices convert. This rate adjusts all likelihoods to that of the desktop trial, meaning the conversion rates will be a bit higher than their raw, unadjusted counterparts.
Eventual conversion rate: The conversion rate as of day 120 for a given cohort. This rate can be either unadjusted or adjusted; if no modifier is used it is assumed the rate is unadjusted. If you’re curious why we chose 120 check out the notebook but basically because it corresponds to a quarter, is divisible by lots of numbers, and 99% of all subs happen before this date.
Increase in conversion rate: the percent change in conversion rate from the cohorts before the new product. Note this is a relative rate! So if conversion increases from 20% to 25% the increase is 25% ((25-20)/20) not 5%! This seems like a dumb point but wires get crossed on this every. damn. time.
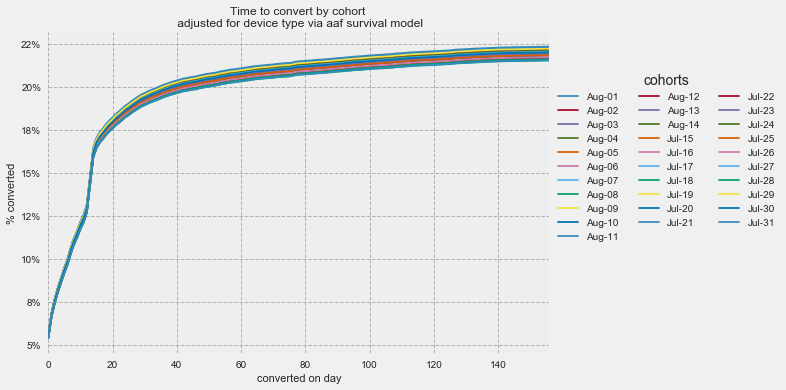
#2 Identifying a baseline conversion rate
Before we can look for an increase we need to understand how much the conversion rate varies typically. If you flip a coin 100 times and get 51 heads it would take a special ego to boast about increasing the rate of heads by 2%. If we adjust the conversion rate to take into account the different rates for different devices used to start trials (remember- desktop is higher) we get a plot like what you see on the left or an eventual conversion rate like what you see on the right.

Using the baseline to set the lower bound of the conversion rate key result
Our key result for the new product should be at least as big as half the confidence interval- in this case greater than half a percent. There’s a tradeoff between magnitude and the number of observations (you can call bs on a coin that comes up heads 90% of the time a lot faster than one that comes up heads 51% of the time.) and we don’t want to be explaining to investors that there might be a 0.05% increase in conversion from something we did 6 months ago.
#3 the subjective case for the new product’s impact

This is a plot of each feature and the impact on the likelihood of converting (in this model called a hazard rate thus the (HR) on the x axis). Notice how all our previous feature launches cluster around this like while device type exhibits a much larger impact.
Some helpful context for what we might expect in terms of conversion increase is the performance of previous product launches. Have we been able to impact conversion rate before? If so by how much? Ideally these features were rolled out to a treatment group first and you’re using some awesome causal impact analysis to determine the effect of each release. But in reality your CEO, delirious from lack of sleep and on a fundraising deadline, called up a bunch of customers and journalists bragging about the new feature with you feebly complaining about ‘methodology’ in the background.
Looking at the conversion rates around the past two feature releases, we don’t see any change in conversion. That doesn’t mean it isn’t doing something subtle behind the scenes or isn’t creating value in other ways (be sure to check for changes in user characteristics!) but it probably means 10% growth is a bit ambitious, especially if any of those features were designed to impact conversion.
Inferring the priors of your stakeholders
The next step is super important and requires some math and some social skills- go out to all your stakeholders and ask them how they think each of the previous product launches impacted conversion. Some are going to spit back to you super precise numbers from the dashboard you made, others are going to give hand wavy answers, but try to get a sense of their priors related to product launches. Be sure to pry- ask why mechanisms they believe contributed to this outcome, what specifically about the product caused the change? Was the impact immediate or gradual? It’s important to do this in person- you don’t want their researched emails, you want their off-the-cuff estimate of how features change conversion rate.
Now comes the hardest part- working with all those stakeholders to determine a reasonable number between 2.5% and ∞%. The data are telling us to aim kind of low on this since literally any impact is more impact than we’ve observed from any previous products. People are not always great at estimating and there is a lot of complexity here. Here are two tricks that may help:
Converting the metric to dollars. Knowing that each percent increase in conversion results in $x more revenue makes it a lot easier to understand what’s needed. At a minimum it needs to cover the cost of the team working on the feature. This requires a good LTV model which, hopefully, you have.
Moderating estimates with stakeholder priors. Knowing the product, customers, and market can go a really long way toward creating good estimates. Your stakeholders are hopefully very knowledgeable in these dimensions. However, use the priors these people gave you previously to know when to push back. Maybe push the guy who thought your last feature hockey sticked conversion (when it totally did not) on what specifically about the feature will cause people to subscribe more frequently.
Our key result
After careful consideration with our stakeholder we decide that a cohort using the new product should have an eventual adjusted conversion rate increase of 7%. This means our eventual adjusted conversion rate should increase from 22.5% today to ~24.1%.. To avoid creating a culture of people that sound like robots, let’s just roll this out to everyone as “we are setting ourselves the goal of increasing conversion by 7%!“
#4 Aggressively Tracking Progress
**a note about product launch data strategy
The 100% best, right way to do this is by rolling the feature out to a subset of users and using some sort of impact analysis to see if their behavior deviates from that of the control group. In my experience however, this is rarely possible. At larger companies there are tons of promotions, marketing campaigns, other feature launches, etc that can make picking a treatment/control group very difficult. At smaller companies, especially B2B, you’re lucky to have enough users to measure the effect at all, much less after dividing them into treatment/control groups.
If you’re lucky enough to have the option to roll out your product to a test group, check out some of the awesome resources on impact analysis. Here I’ll cover there arduous task of trying to assess impact without this luxury.
Building a dashboard
If we want just one plot to plaster everywhere to keep an eye on this type of thing I think this is the right one.

It conveys the variance inherent in this process (basically saying “I think this is what’s happening but we could still be wrong and here’s by how much we could still be wrong.”) and the temporal aspect of conversion- namely that it’s something that happens over time and while we think this is where we’re going to end up we still have a lot to observe.
Two other useful plots are the plots of only what we’ve observed so far against the baseline and another showing our two beta distributions. The former succinctly captures all information known to date without any assumptions on our part (helpful if we are violating a assumption or our model is off!) and the later captures the answer to the question “what impact is the new product having and how sure are we?“. All three of these plots can stay the same over time, getting gradually more accurate and informative.


Summary
We used data to understand more about the metric we were hoping to impact, set a goal for the product team and thanks to a survival regression model, deliver a real time estimate of eventual conversion rate while updating our priors with new information. There are a few themes that stand out in this process:
Transparency through variance: Our model and dashboards always represent a measure of uncertainty. Even if you aren’t a critical rationalist you know we may be inferring patterns in these data that aren’t necessarily reflective of long-term reality.
We’re learning about the ‘levers’ that impact conversion rate: The best part about tracking a metric is all the cool stuff you learn along the way. Even if this feature is a total dud we are still well on our way to creating an excellent conversion rate forecast. We’re even able to coalesce around specific language that allows everyone to develop a shared understanding about complex things without sounding like nerds.
Flexible measurement: This approach probably isn’t (and definitely shouldn’t) be found under the methodology section of any whitepaper. But running a business is mad hard and there are tons of different factors to weigh. It’s imperative that you have a voice for data who understands the different options when measuring a new product and can make the tradeoffs clear to decision makers. This is so imperative it may even warrant another post?